
Here comes the global war. Nadchodzi globalna wojna
Autor Bogdan Góralski
1. Introduction
As is clear from my research intercontinental and regional climatic fluctuations shape the global prices of food and energy resources. I noticed that increasing the wheat harvest followed by increasing acreage in response to the increase in global wheat prices. This occurs in a repetitive cycle, which is probably related to the cycle of solar activity.
Last occurring in the period 1980-2006, fluctuations in the price of wheat fluctuated between 110-260 USD per ton and affect the size of financial flows in the international banking system. Financial flows increased in periods of increases in food prices, after which followed commodity prices.
A noticeable recently in 2014, a decline in food prices due to the large acreage and favorable weather conditions reduces commodity prices and financial flows, which can lead to depression, reducing the area of agricultural crops and consequently to the next rise in global food prices. This is likely due to the approaching climate crisis associated with the next solar activity minimum after cycle 24, which cause deterioration of climatic conditions and a large drop in food production in Asia, North Africa and Western countries.
Solving the problem of the Earth’s climate mechanism, and coupled with the world economic system requires international scientific cooperation, as well as concentrate and coordinate efforts and resources of national research institutes. In short, we need cooperation and money for research.
My idea to solve the problem of shortage of funds for extensive research is based on the establishment of an international foundation for international trade, whose profits would be entirely devoted to research important for global civilization problems. The owners and employees of the foundation would be young people from around the world. I know how the foundation organize and lead. This foundation would organize a platform of cooperation for scientists from around the world.
Scientists should convince politicians that a minimum of solar activity, which most likely will start around 2019 threaten our global civilization, global war. In the history of the last few centuries, every serious a minimum of solar activity resulted in a deterioration of climatic conditions on the planet, which were responsible for soaring food prices.
Masses of people, ignorant cosmic and global mechanisms to respond to the rising food prices rising levels of aggression, which ends with revolutions and wars. The next global war could bring destruction of our civilization, so it’s important organized international cooperation of scientists aiming to change attitudes to the threat of war politicians of all countries. Reprehensible is the insistence of world opinion-forming circles with false thesis about the threats arising from global warming. It is a kind of false ideology, which I call the new Marxism. This ideology if not overcome, will bring disaster to the world.
2. Global social and economic changes due to changes in solar activity.
As is clear from my research intercontinental and regional climatic fluctuations shape the global prices of food and energy. This is confirmed by the following chart showing the relationship of oil prices on the prices of agricultural products. Food importers, mainly oil and gas producing countries, and rise in prices of food forces them to raise prices of oil and gas to balance national budgets. Reducing food prices causes the opposite effect.
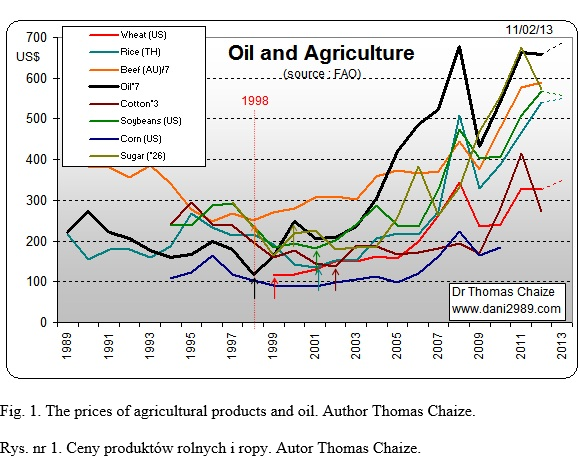
Fig. 1. The prices of agricultural products and oil. Author Thomas Chaize.
Food prices depend on climatic conditions and the economic mechanism that shapes optimum for food producers area of agricultural crops. This can be seen in the graph below showing the pulsing prices of wheat and area of crops. Any increase in wheat prices will increase in the crop area and vice versa.
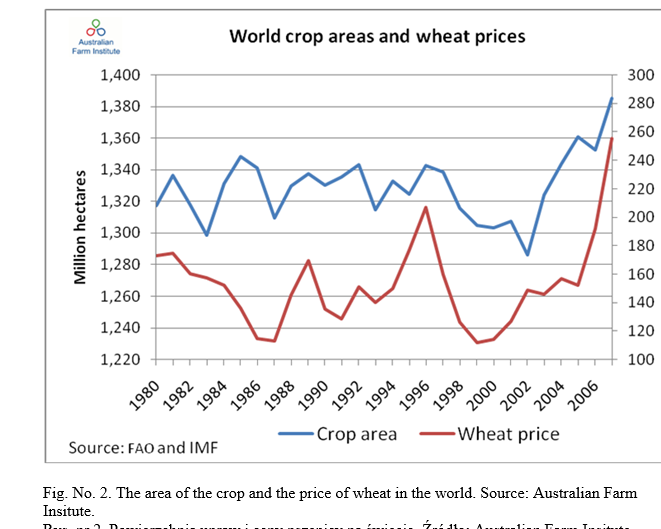
Fig. No. 2. The area of the crop and the price of wheat in the world. Source: Australian Farm Insitute.
Prices of wheat and food depend mainly on climate change that enhances the yield per unit area of crops. Changes in wheat prices over the centuries shown in the following charts:
 Rys. nr 3. Real prices of wheet in years 1657-2005. Source: SG Cross Asset Research, GFD.
Rys. nr 4. Real prices of wheet in London according to Wilhelma Abla (1935).
Autor of the graph Bogdan Góralski.
The chart below shows the impact of demand on food prices and enlargement
area of agricultural crops in the lower Normandy in the period 1397-1956.

Fig. 5. Changes in crop area in response to changes in food prices in lower Normandy on the example of the village Beaurfour and Vitotel around the city of Neubourg in France in the period 1397-1956. Author figure Bogdan Góralski.
Data series:
Color fiolet- Series 2 – the area of agricultural crops in the village Beaufour and Vitotel in lower Normandy
by. André Plaisse (1965) in hectares.
Color Blue for Series 1- real prices of wheat in London by. Wilhelm Abel (1935) in German marks.
Wheat prices grew in London (and grain markets everywhere shape similar prices) from 1544 years due to demand growing population of English (and French as well) and with them grew areas of agricultural crops (demand shapes supply). Around 1810 years there has been a turning point and the price of wheat, food began to decrease, and with them the area of agricultural crops. From what resulted of these changes?
During this period in Europe Little Ice Age lasted associated with the Maunder Minimum and Dalton Minimum-minima of solar activity.
The deterioration of climatic conditions during lows in solar activity and the accompanying decline in yields per hectare and the growing population forced a rise in prices of agricultural products, prompting producers to increase crop area.
At the same time it experienced the phenomenon of de-concentration of agricultural property in reducing the average area of agricultural property. Population bought small parcels of land to cultivate it and stay alive in the conditions of rocketing food prices. After 1820 there was a decline in wheat prices, food and pointed downward trend area of agricultural crops, as well as the Spring of Nations, the concentration of agricultural property – an increase in the average area of agricultural property, which continues to this day and has led to the creation in Western countries of large agricultural estates. In Asia, it is China recently moved away from the rural communes and now Asian agricultural system is based on a lease small plots of land cultivated by a very large population of Asian farmers.
The phenomenon of de-concentration and concentration of agricultural property is visible in the figure below illustrating the variation in time of an average area of agricultural property. Phenomena deconcentration of farm property took place in the period before the French Revolution and the Napoleonic Wars (Plaisse 1965: 94 Tab. No. 18), and today continues in the most overpopulated countries in the world.
The concentration of agricultural property occurs in less populated countries of the West and makes the process of ownership concentration in the entire economy. They form large estates agricultural and industrial giants, and decreases the number of medium and small businesses. Decreases production efficiency of the economy, the general public becomes poorer, and capital accumulates in the hands of a small group of people. This process leads to revolution.
Action is needed to de-concentration of ownership that will protect Western nations against revolutions. Such action is the introduction in a modern Western countries feudal agricultural production system based on the lease small plots of agricultural land. This will lead to the displacement of huge masses of the rural population of Asia, Africa, to the countries of the West, will increase global food production and lead to the de-concentration of ownership in the rest of the economy of the West, which will restore its productivity and efficiency. This will prevent the global crisis.

Fig. No. 6. Changes in the area of crops and farming structure in the lower Normandy on the example of the village Beaurfour and Vitotel around the city of Neubourg in France in the period 1397-1956.
Author figure Bogdan Góralski.
Data series:
Series 2 – Color fiolet- area of agricultural crops in the village Beaufour and Vitotel in lower Normandy
by. André Plaisse (1965) in hectares.
Series 1 Colour Blue for the average area of agricultural property in the village Beaufour and Vitotel in [ha]
According to the World Bank (http://data.worldbank.org/indicator/AG.LND.AGRI.ZS) total area of arable land since 2005 has declined from 38% of 0.5%.
The study (Ray at al. 2013) states:
Several studies have shown that global crop production needs to double by 2050 to meet the projected demands from rising population, diet shifts, and increasing biofuels consumption.
The global food supply can only be improved by increasing the areas of crops and increase yields per hectare. Reserves of farmland have only countries of Western civilization, in which there was a widespread concentration of agricultural property. The cultivated area has decreased due to a reduction in global food prices, resulting from favorable global climatic conditions last centuries. The lands of huge latifundia Western countries should be settled farmers from Asia and Africa. Asia, Africa, has a an excess of agricultural people and there are no reserves of arable land. Land which has Western civilization, the need hands to work, because they cause an increase in yields per hectare, on intensively cultivated small plots of land. Meet this challenge can only
the re-introduction of modern agricultural feudal system of Western countries.
3.Proposals.
During the Maunder Minimum occurred Thirty Years War, and during the Dalton Minimum French Revolution and the Napoleonic wars and so-called. Spring nations. Another slight decrease in solar activity, measured by the number of sunspots,
at the turn of the nineteenth and twentieth centuries it resulted in revolutions Chinese, Mexican and Russian and the First World War. This can be seen in the following figure:

Fig. 7. Changes in solar activity measured by the number of sunspots. Source Wikipedia.
Wars and revolutions resulted from the increasing aggression of the global society caused by deterioration in times of minima of solar activity, living conditions, ie. Mainly the sharp rise in food prices resulting from a small supply of food. This is illustrated in the following figure:

Fig. 8. Dependence of the frequency of wars and revolutions in Europe and changes in food prices rendered by the price of wheat. The development of Europe’s population mapped by
development of the population of England in the years 1541-1910. Author figure Bogdan Góralski.
Source of drawing (Góralski 2014: 127)
Data series:
Series 1 – Colour Blue for changes in wheat prices in London (Abel 1935: 174-175) in German marks
Series 2 – Color Pink- The population of England (Wrigley, Schofield 1981).
Series 3 – Color Yellow – changes in the birth rate in England (the ratio is calculated on the basis of births (Wrigley, Schofield 1981)).
Series 4 – Color aquamarine- frequency of wars and revolutions in Europe (Tilly 1997).
After the solar cycle 24 spots will come a reduction in solar activity, which will start around 2019, as a result of the work of American geophysicists (see page Solar Weather Prediction Center). What it end? According to geophysicist Ivanka Charvatowa, minima of solar activity are associated with disorders motion of the Sun around the center of mass of the solar system (Charvatowa 2000: 401). Currently, we are in such a period, a new minimum of solar activity (from 1985 until 2040).
Scenario depends on the honesty of scientists who adopt proven arguments, they should put pressure on politicians to prevent the catastrophe of a new world war, which draws in perspective.
Political action aimed at avoiding war described in a book entitled “Man and climate”, available in Polish on the Internet in the Repository CEON – link: https://depot.ceon.pl/handle/123456789/4855 , and in a book entitled “Mechanism The climate of the Earth and the social impacts of climate change “- link: http://jbc.bj.uj.edu.pl/dlibra/docmetadata?id=266462&from=&dirids=1&ver_id=&lp=4&QI=
available in Polish at the Jagiellonian Digital Library.
Warsaw, on 22-23 November 2014 Bogdan Góralski
Literatura:
Abel Wilhelm (1935), Agrarkrisen und Agrarkonjunktur in Mitteleuropa vom 13. bis zum 19. Jahrhundert, Berlin1935.
Charvatowa Ivanka (2000), Can origin of the 2400-year cycle of solar activity be caused by solar inertial motion?, Ann. Geophysicae 18, 399±405 (2000) Ó EGS ± Springer-Verlag 2000, pobrano z internetu w 2014 roku-link: http://www.ann-geophys.net/18/399/2000/angeo-18-399-2000.pdf
Góralski Bogdan (2014), Człowiek i klimat, Repozytorium CEON- dostępna w Internecie.
Plaisse André (1965), L’évolution de la structure agraire dans la campagne du Neubourg, Mouton & Co, Paris.
Ray Deepak K. , Mueller Nathaniel D., West, Paul C., . Foley Jonathan A. (2013), Yield Trends Are Insufficient to Double Global Crop Production by 2050, Published: June 19, 2013 DOI: 10.1371/journal.pone.0066428.
Tilly Charles (1997), The European Revolution 1492-1992, Rewolucje europejskie 1492-1992. Tworzenie Europy, tłum. Ewa Żelazna, Warszawa: Wydawnictwo Krąg Oficyna Wydawnicza Volumen.
Wrigley E.A., Schofield R.S.(1981) The Population History of England 1541-1871. A reconstruction, London: Edward Arnold Publishers Ltd.